A practical guide for Linux VPS owners. Takes about 15 minutes.
Provider spec sheets tell you how many vCPUs, how much RAM and what disk a plan includes. They don’t tell you how fast those resources actually are. Two VPS plans with identical specs can perform very differently because of the CPU model, how heavily the host node is oversold, and the storage backend behind your disk.
The good news: you don’t need a paid tool to find out. Three free, open-source utilities cover everything. sysbench tests CPU and memory, fio tests disk I/O, and iperf3 tests network throughput. This guide gives you the exact commands, explains how to read the output, and points out the mistakes that make benchmark results meaningless.
What You’ll Need
Table of Contents
- A Linux VPS (the commands target Ubuntu/Debian, with notes for AlmaLinux, Rocky and other RHEL-family systems)
- Root or sudo access
- A second server for the network test (another VPS or your own machine)
- About 3 GB of free disk space for the disk test
Important: run these tests on a new or idle VPS. The disk test generates heavy I/O and can slow down any websites running on the server at the same time.
Step 1: Install the Tools
Ubuntu / Debian:
sudo apt update
sudo apt install -y sysbench fio iperf3
AlmaLinux / Rocky / RHEL:
sudo dnf install -y epel-release
sudo dnf install -y sysbench fio iperf3
Confirm everything installed:
sysbench --version
fio --version
iperf3 --version
Step 2: Record Your Hardware First
Results only make sense next to the specs they came from. Note these down before you test:
lscpu | grep -E 'Model name|^CPU\(s\)|MHz'
free -h
df -h /
This gives you the CPU model, number of vCPUs, RAM and free disk space.
Step 3: Test CPU Performance with sysbench
sysbench’s CPU test calculates prime numbers and reports how many it can complete per second. Run it twice: once on a single thread and once using all your vCPUs.
# Single thread
sysbench cpu --cpu-max-prime=20000 --threads=1 run

# All vCPUs
sysbench cpu --cpu-max-prime=20000 --threads=$(nproc) run
The lines that matter in the output:
- events per second: higher is better
- total time: lower is better
- latency (avg / 95th percentile): lower and more consistent is better
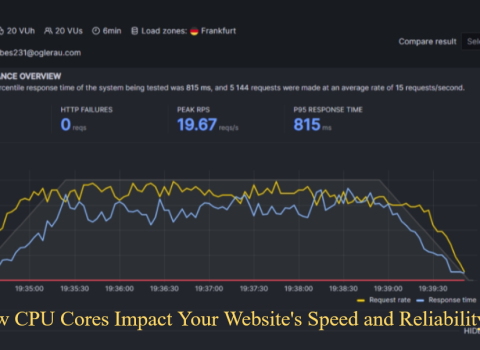
How to read it: single-thread speed shows how fast each core is, which matters for PHP, WordPress and most web workloads. The multi-thread result should scale close to your vCPU count. If a 4 vCPU plan only gives you about 2x the single-thread score, the CPU is being shared or throttled. For a deeper look at how cores affect real websites, see our guide on how CPU cores impact your website’s speed.
Watch for steal time. While the test runs, open a second terminal and run:
vmstat 1Look at the st column. It shows the percentage of CPU time your VPS wanted but the hypervisor gave to someone else. As a rule of thumb, steal time that stays above about 5% means the host node is overcrowded.
Step 4: Test Memory Speed
sysbench memory --memory-block-size=1M --memory-total-size=10G --threads=1 runLook at the MiB/sec figure. Memory speed rarely differs wildly between providers, but very low numbers can point to an overloaded host or an old platform.
Step 5: Test Disk Performance with fio
Disk speed is where VPS plans differ the most, and it is the number that most affects database-heavy sites. We will run four tests that cover the main real-world patterns.
The key flags:
--direct=1bypasses the operating system cache so you measure the disk, not RAM--bsis the block size (1M for sequential, 4k for random)--iodepthis how many requests are queued at once--runtime=60 --time_basedruns for a full 60 seconds, which exposes burst limits that short tests miss
Sequential write (large file copies, backups):
fio --name=seq-write --filename=fio-test --size=2G --bs=1M --rw=write \
  --ioengine=libaio --direct=1 --iodepth=16 --runtime=60 --time_based --group_reporting
Sequential read:
fio --name=seq-read --filename=fio-test --size=2G --bs=1M --rw=read \
  --ioengine=libaio --direct=1 --iodepth=16 --runtime=60 --time_based --group_reporting
Random 4k read (databases, CMS page loads):
fio --name=rand-read-4k --filename=fio-test --size=2G --bs=4k --rw=randread \
  --ioengine=libaio --direct=1 --iodepth=32 --numjobs=4 --runtime=60 --time_based --group_reporting
Random 4k write, or mixed 70/30 read-write:
fio --name=rand-write-4k --filename=fio-test --size=2G --bs=4k --rw=randwrite \
  --ioengine=libaio --direct=1 --iodepth=32 --numjobs=4 --runtime=60 --time_based --group_reporting

fio --name=mixed-4k --filename=fio-test --size=2G --bs=4k --rw=randrw --rwmixread=70 \
  --ioengine=libaio --direct=1 --iodepth=32 --numjobs=4 --runtime=60 --time_based --group_reporting
When you finish, delete the test file:
rm fio-testReading the fio output:
- IOPS: operations per second. This is the headline number for random tests.
- BW: throughput in MiB/s. This is the headline number for sequential tests.
- clat percentiles (p99): completion latency. A good disk keeps p99 low and steady. Large spikes usually mean noisy neighbours.
Sequential speed is mostly about bragging rights. Random 4k IOPS and latency are what decide how fast your database and website feel.
Step 6: Test Network Speed with iperf3
iperf3 needs two machines: a server and a client. Using a server close to your VPS gives you the most useful result.
On the server (the machine you test against):
iperf3 -sIf it has a firewall, open the default port first:
sudo ufw allow 5201On your VPS (the client):
# Standard 30-second upload test
iperf3 -c SERVER_IP -t 30

# Reverse mode: tests download speed
iperf3 -c SERVER_IP -t 30 -R

# 4 parallel streams, better for high-latency links
iperf3 -c SERVER_IP -t 30 -P 4
Replace SERVER_IP with the real address. Many providers and community members also publish public iperf3 servers you can test against if you don’t have a second machine.
What to check:
- Bitrate (sender and receiver): should land close to your advertised port speed. A 1 Gbps port that only delivers 300 Mbps deserves a support ticket.
- Retr (retransmits): should be low. High numbers mean packet loss on the path.
For latency and routing, add a quick check:
ping -c 20 SERVER_IP
mtr -rw -c 50 SERVER_IP
How to Read Your Results
These are rough guides, not guarantees. Numbers vary by plan, node and time of day.
| Metric | Where to find it | What to look for |
|---|---|---|
| CPU single-thread | sysbench events/sec | Only meaningful compared with other servers tested with identical settings |
| CPU scaling | multi-thread vs single-thread | Should be close to vCPU count x single-thread score |
| Steal time | vmstat st column |
Consistently above about 5% suggests an overcrowded node |
| Random 4k IOPS | fio | HDD: roughly 100 to 200. SATA SSD: tens of thousands. NVMe: often 100k or more, though plans may cap it |
| Disk latency | fio clat p99 | Low and steady. Big spikes point to contention |
| Network | iperf3 bitrate | Close to the port speed, with few retransmits |
5 Mistakes That Ruin VPS Benchmarks
- Running the test once. Run each test at least three times, at different times of day, and use the median.
- Skipping
--direct=1in fio. Without it you are measuring RAM cache, not your disk. - Testing the network against a far-away server. Distance adds latency and lowers throughput. Test against a nearby server and note where it is.
- Comparing results with different settings. A sysbench score with
--cpu-max-prime=20000cannot be compared with one using the default. Keep every parameter identical across providers. - Running short tests. Some plans allow a fast burst and then throttle. A 60-second test shows what you get when the burst is gone.
Bonus: A Quick All-in-One Script
Save this as vpstest.sh, run it with bash vpstest.sh, and keep the output for comparison:
#!/bin/bash
echo '== System =='
lscpu | grep -E 'Model name|^CPU\(s\)'
free -h | grep Mem

echo '== CPU: 1 thread =='
sysbench cpu --cpu-max-prime=20000 --threads=1 run | grep -E 'events per second|total time'

echo '== CPU: all threads =='
sysbench cpu --cpu-max-prime=20000 --threads=$(nproc) run | grep -E 'events per second|total time'

echo '== Memory =='
sysbench memory --memory-block-size=1M --memory-total-size=10G --threads=1 run | grep -E 'MiB transferred'

echo '== Disk: random read 4k =='
fio --name=rr --filename=fio-test --size=1G --bs=4k --rw=randread --ioengine=libaio \
  --direct=1 --iodepth=32 --numjobs=4 --runtime=30 --time_based --group_reporting | grep -E 'IOPS|BW'

echo '== Disk: random write 4k =='
fio --name=rw --filename=fio-test --size=1G --bs=4k --rw=randwrite --ioengine=libaio \
  --direct=1 --iodepth=32 --numjobs=4 --runtime=30 --time_based --group_reporting | grep -E 'IOPS|BW'

rm -f fio-test
Frequently Asked Questions
Is it safe to run fio on a live VPS? It is safe for your data, because fio only writes to the test file you name. It does create heavy disk load, so run it during quiet hours or on a fresh server. Some providers also limit sustained disk activity, so check your plan’s fair-use rules first.
Why are my results lower than the provider’s marketing numbers? Marketing figures usually come from ideal conditions: an empty node, short bursts and large block sizes. Your 60-second random 4k test reflects a much more realistic workload.
How often should I re-test? Test when you first get the server, then again after major changes or if the site feels slow. Repeat testing also catches a node that gets crowded over time.
Do these tests work on Windows VPS? sysbench and fio have Windows builds, and iperf3 works too, but the commands above are written for Linux.
Conclusion
A 15-minute test with sysbench, fio and iperf3 gives you hard numbers instead of marketing claims. Record your CPU scores, random-disk IOPS and network throughput, repeat each test a few times, and compare providers using identical settings.
Once your benchmark is done, keep an eye on the server over time with our list of the best VPS uptime monitoring tools, and if you’ve just set up a new server, follow our post-purchase Linux VPS checklist to secure it.